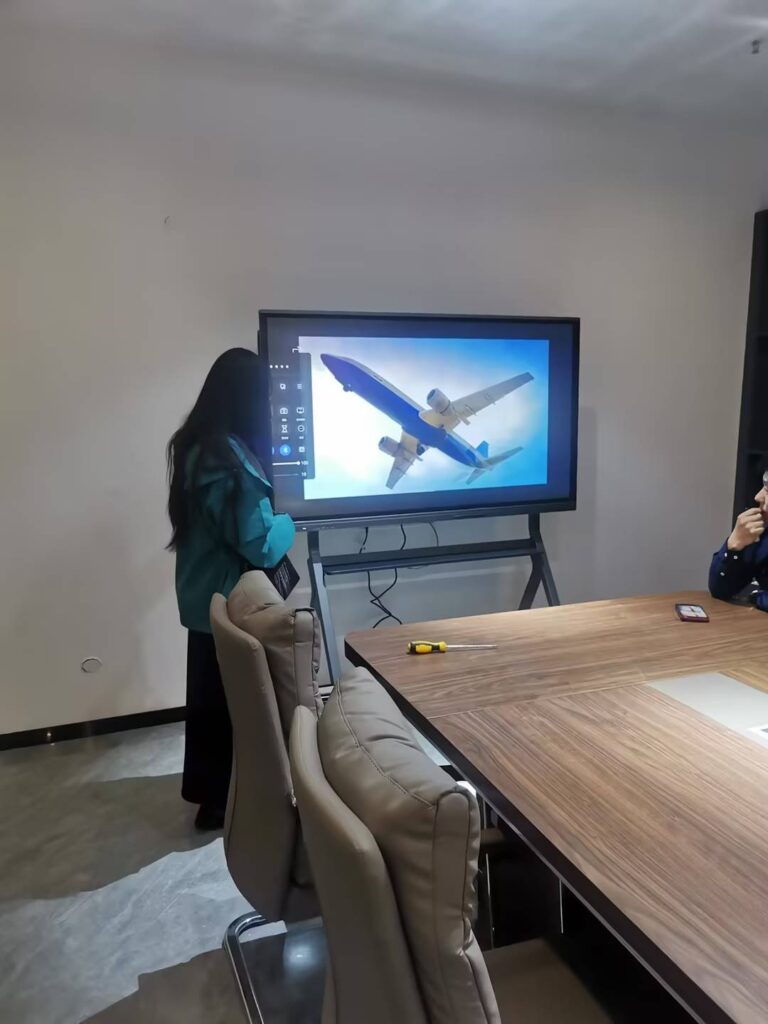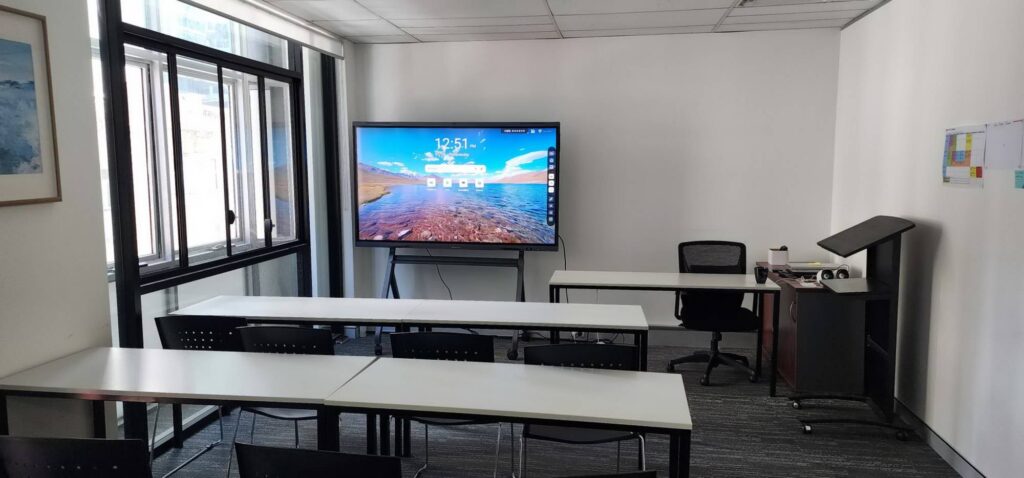
Every department generates data — sales pipelines, support tickets, production output, marketing leads, HR turnover. The challenge for most managers is not collecting that data, but seeing it clearly, discussing it together, and acting on it quickly. A smart board for departmental performance analysis solves exactly this problem: it turns a wall-mounted interactive display into a living, touch-enabled dashboard where KPIs are visualized, annotated, and reviewed in real time by the whole team.
In this guide, you will learn what a smart dashboard board is, which KPIs each department should track, how to set up an interactive performance wall, and how to use it to drive efficiency and data-driven decisions across your organization.
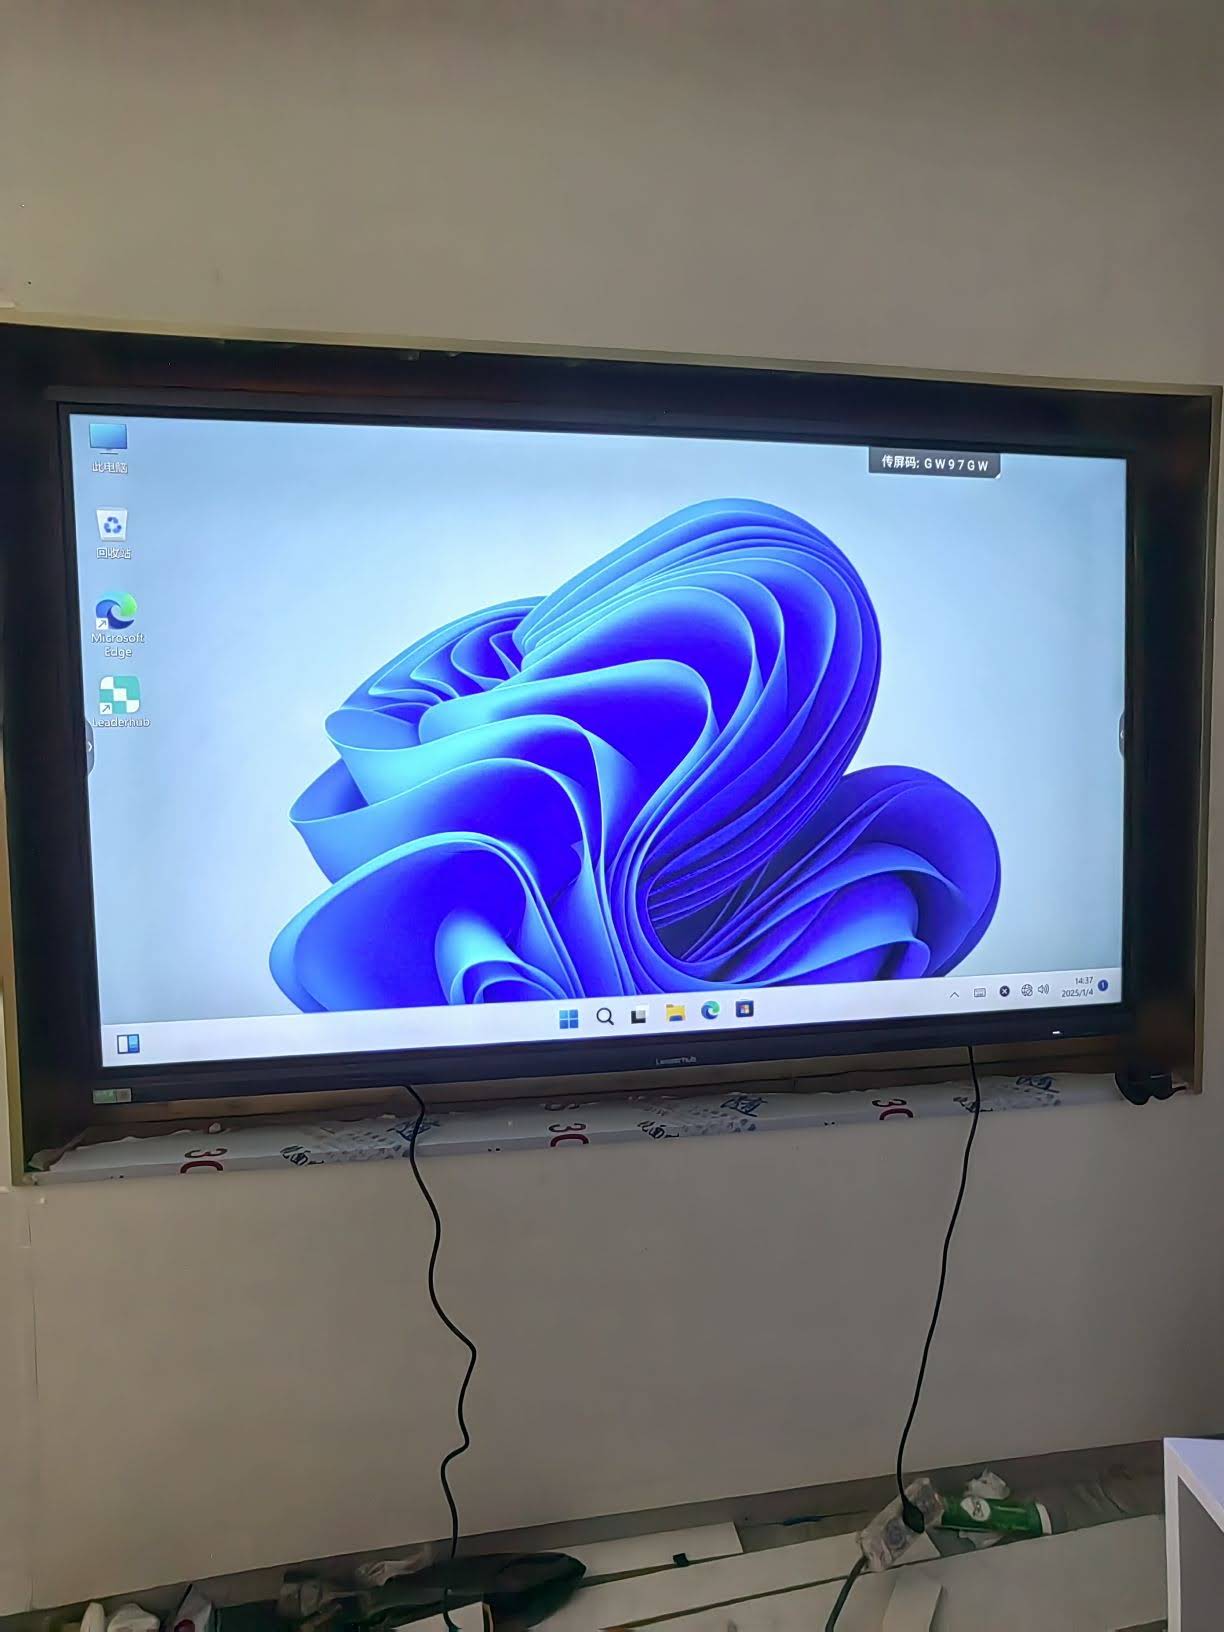
What Is a Smart Board for Departmental Performance Analysis?
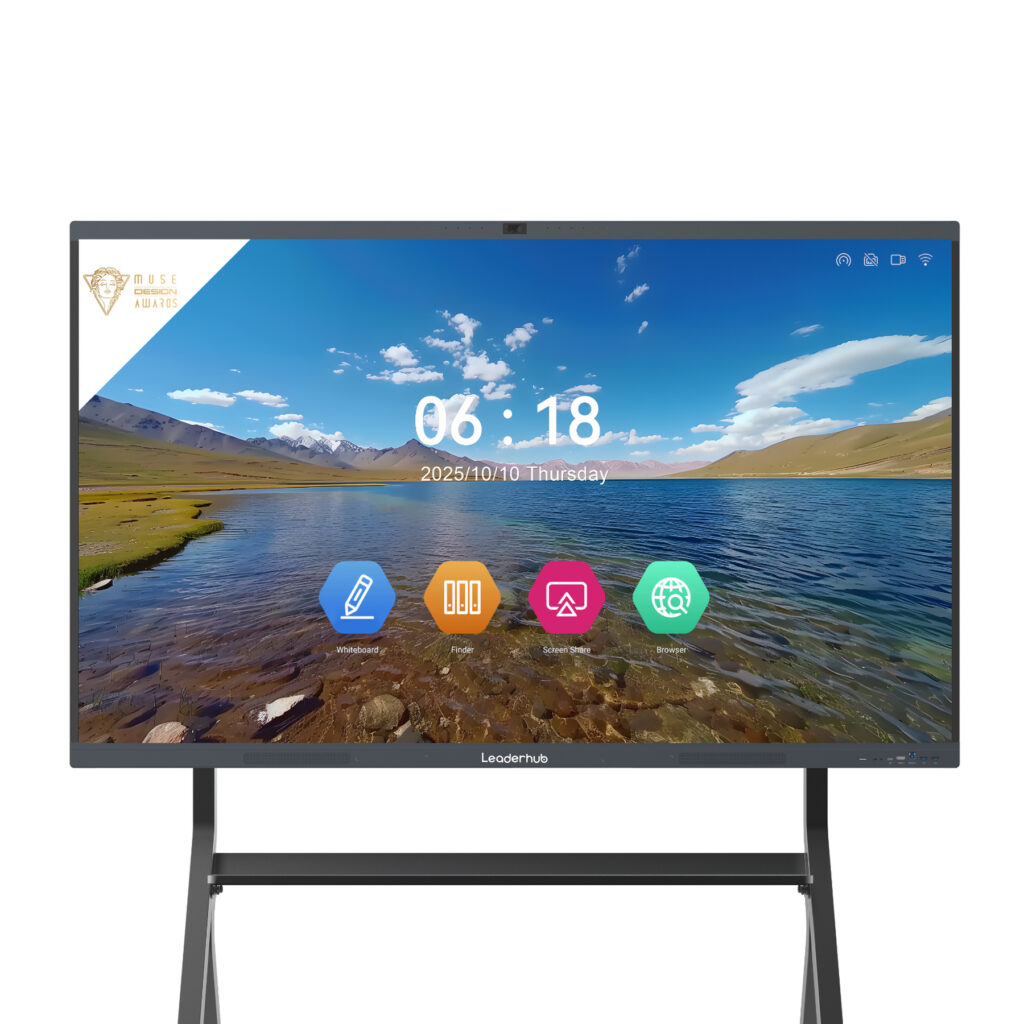
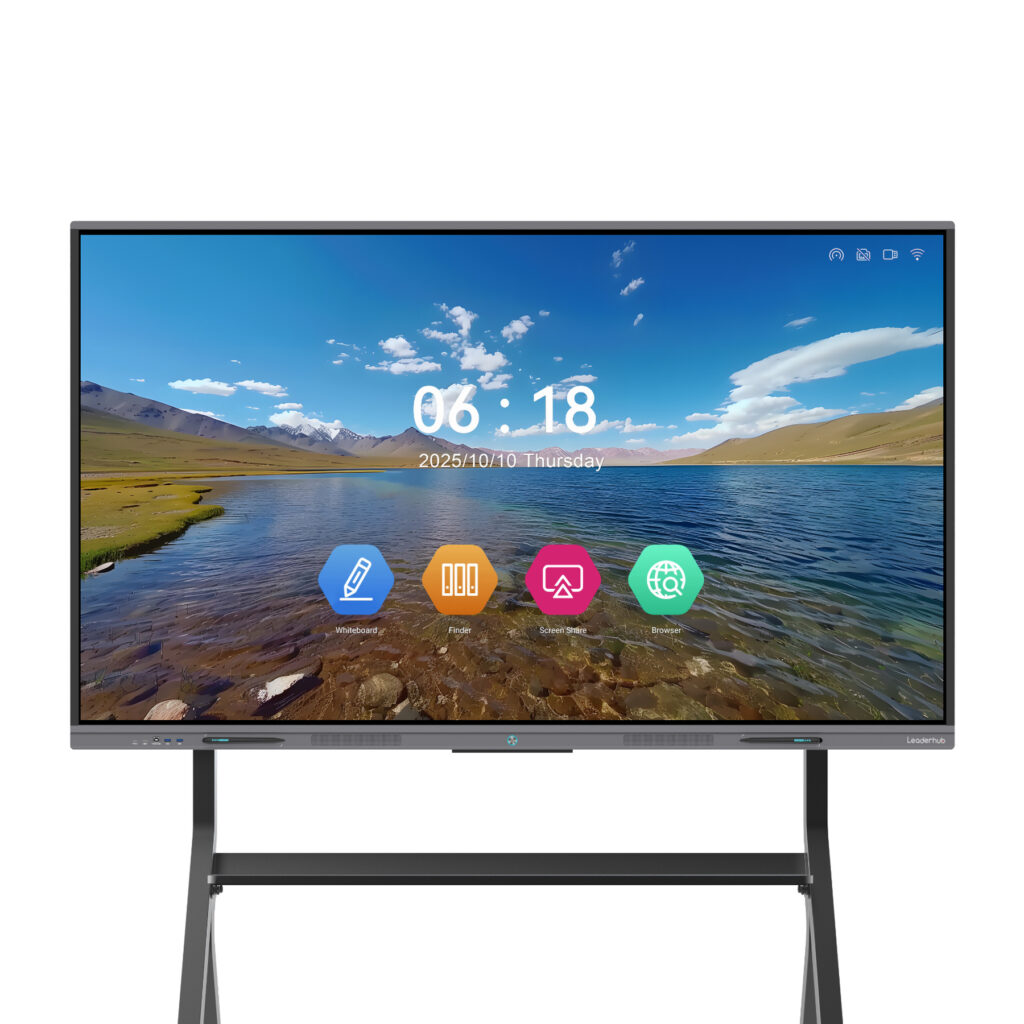
A smart board for departmental performance analysis is an interactive flat panel (typically 55″–110″, 4K resolution, multi-touch) that connects to your business intelligence tools, spreadsheets, CRM, ERP, or project management software, and presents departmental metrics as a large-format, touch-interactive dashboard.
Unlike a static TV screen looping a slide deck, a smart dashboard board allows managers to:
- Drill down into any metric with a tap — from company revenue to regional sales to an individual account.
- Annotate charts directly on the glass during reviews and save the notes to the cloud.
- Switch between data sources such as Power BI, Google Looker Studio, Tableau, Excel, or Notion in seconds.
- Collaborate remotely with hybrid teams through built-in cameras, microphones, and video-conferencing apps.
- Run an always-on performance wall that keeps the whole department aligned on targets every day.
Because the board runs its own operating system (Android or Windows via an OPS module or mini PC), it works as a standalone analytics station — no laptop required.
Why Departments Struggle Without a Visual Performance Hub
Most teams suffer from the same three problems when it comes to performance tracking:
1. Data Silos
Sales lives in the CRM, finance lives in spreadsheets, operations lives in the ERP. Nobody sees the whole picture at once, so cross-departmental decisions are slow and often based on outdated numbers.
2. Passive Reporting
Weekly PDF reports are emailed, skimmed, and forgotten. There is no shared moment where the team looks at the same chart, asks questions, and commits to an action.
3. Low Engagement in Reviews
Traditional review meetings involve one presenter clicking through slides while everyone else checks their phone. Insights rarely turn into owned tasks.
A smart dashboard board addresses all three issues by making data central, visible, and interactive. Research on interactive public displays shows that large shared screens increase group attention and participation compared with individual devices — see this study on interactive displays in educational settings, whose findings translate directly to the corporate meeting room.
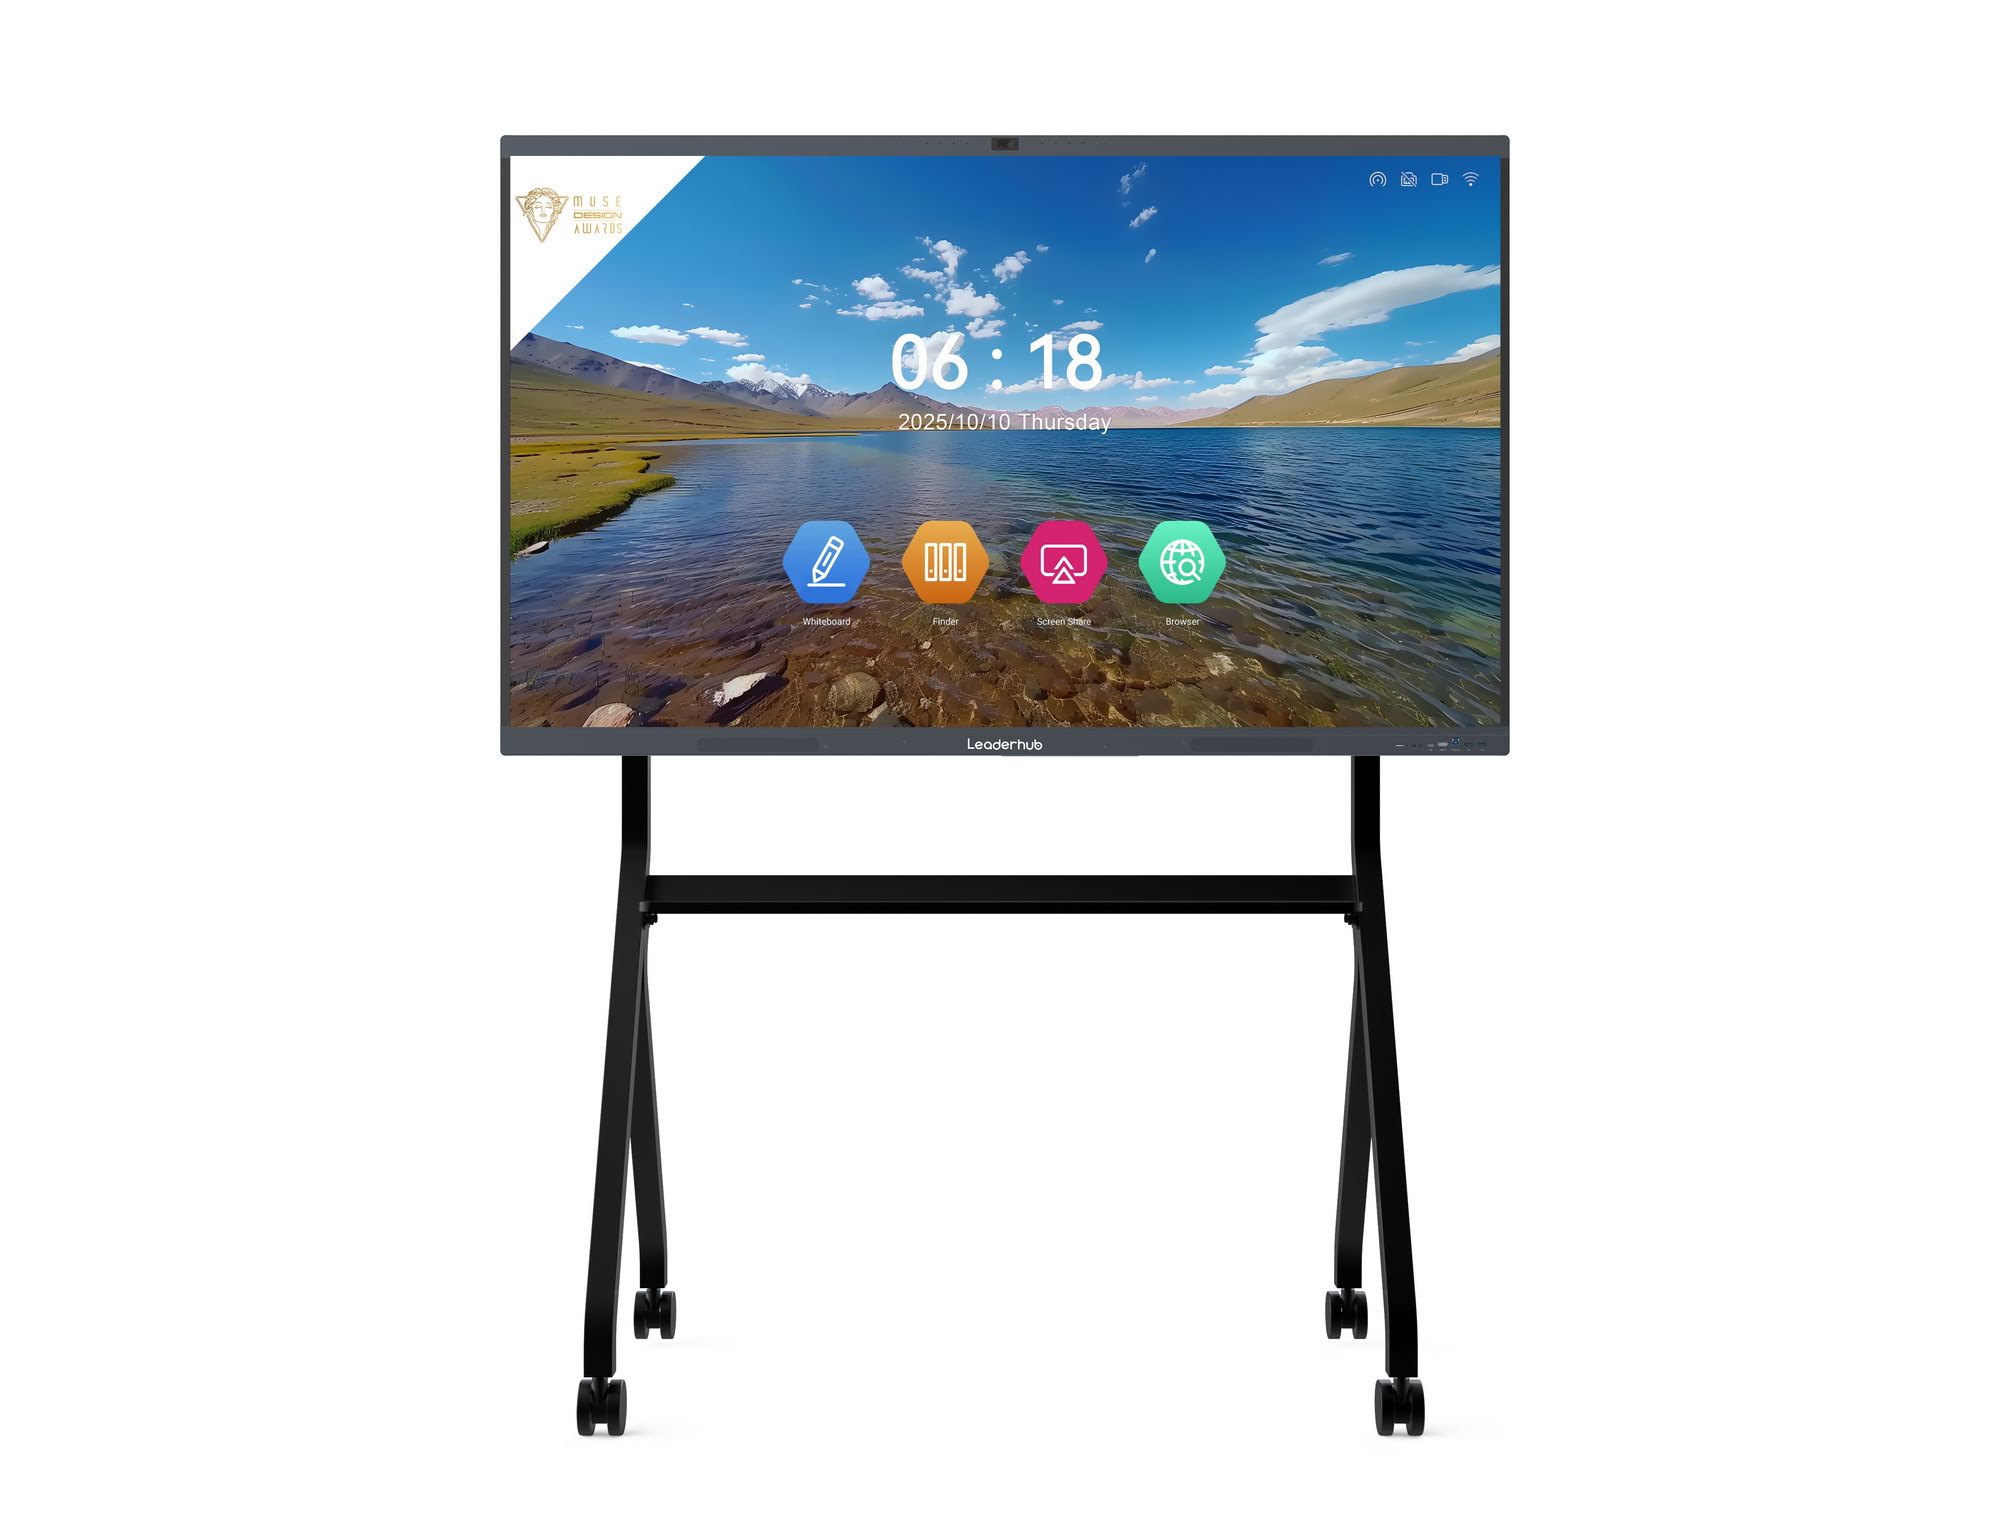
Key KPIs to Track on a Departmental Smart Dashboard
The right KPIs depend on the department, but the principle is the same: show few, meaningful, actionable metrics rather than every number you own. Below is a practical starting framework.
| Department | Core KPIs to Display | Recommended Refresh Rate |
|---|---|---|
| Sales | Pipeline value, win rate, quota attainment, average deal size, sales cycle length | Real-time / hourly |
| Marketing | MQLs, cost per lead, conversion rate, campaign ROI, website traffic | Daily |
| Customer Support | First response time, resolution time, CSAT, ticket backlog, NPS | Real-time |
| Operations / Production | OEE, throughput, defect rate, on-time delivery, downtime | Real-time / per shift |
| Finance | Revenue vs. budget, gross margin, cash flow, DSO, operating expenses | Weekly / monthly |
| Human Resources | Turnover rate, time to hire, employee engagement score, training completion | Monthly |
| Product / IT | Sprint velocity, bug count, uptime, release frequency, feature adoption | Daily / per sprint |
A useful rule: no more than 5–7 KPIs per screen view. If you need more, build multiple dashboard pages and swipe between them on the touchscreen.
How to Set Up a Smart Dashboard Board Step by Step
Step 1: Define the Decisions You Want to Support
Start with the question, not the chart. Ask each department head: “What decision do you make every week, and what data would make it faster?” The answers define your dashboard layout.
Step 2: Choose the Right Display Size and Location
Size depends on viewing distance and room usage:
- 55″–65″ — huddle rooms, small team corners, or mobile carts that move between departments.
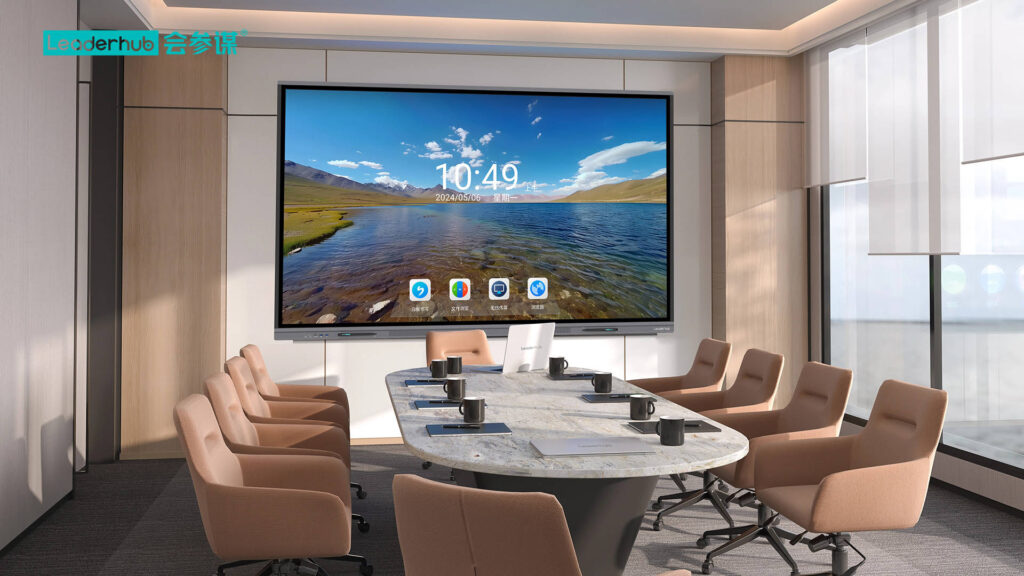
- 75″ — standard conference rooms seating 8–12 people.
- 86″–110″ — large boardrooms, open-plan performance walls, or control-room style command centers.
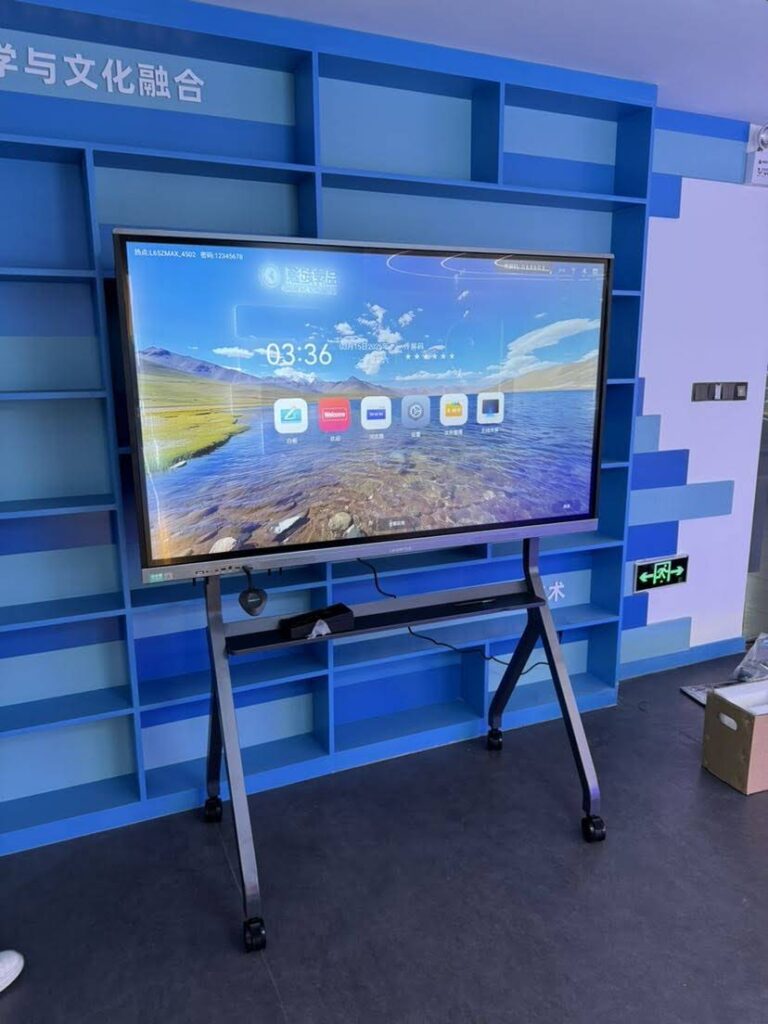
For teams that rotate between rooms, a mobile unit such as the U55Pro 55″ mobile 4K smart display can be wheeled from sales to operations for daily stand-ups.
Step 3: Connect Your Data Sources
Most modern smart boards support the following connection methods:
- Web-based BI dashboards — open Power BI, Looker Studio, Tableau Public, or Grafana directly in the board’s browser.
- Native apps — install Android or Windows apps for Microsoft 365, Google Workspace, Notion, or Trello.
- Wireless screen sharing — cast a dashboard from any laptop or tablet via Miracast, AirPlay, or a dongle.
- Dedicated mini PC — pair the board with a compact Windows PC so the dashboard runs 24/7 without a user logged in.
Step 4: Design for Glanceability
A dashboard that lives on a wall should be readable from across the room. Use large numbers, color-coded status (green / amber / red), consistent chart types, and a clear hierarchy — the most important KPI in the top-left corner.
Step 5: Establish a Review Rhythm
Technology alone does not change behavior; routines do. Pair your smart board with a fixed cadence: a 10-minute daily stand-up in front of the board, a 30-minute weekly KPI review, and a monthly deep-dive with annotations saved and shared afterward.
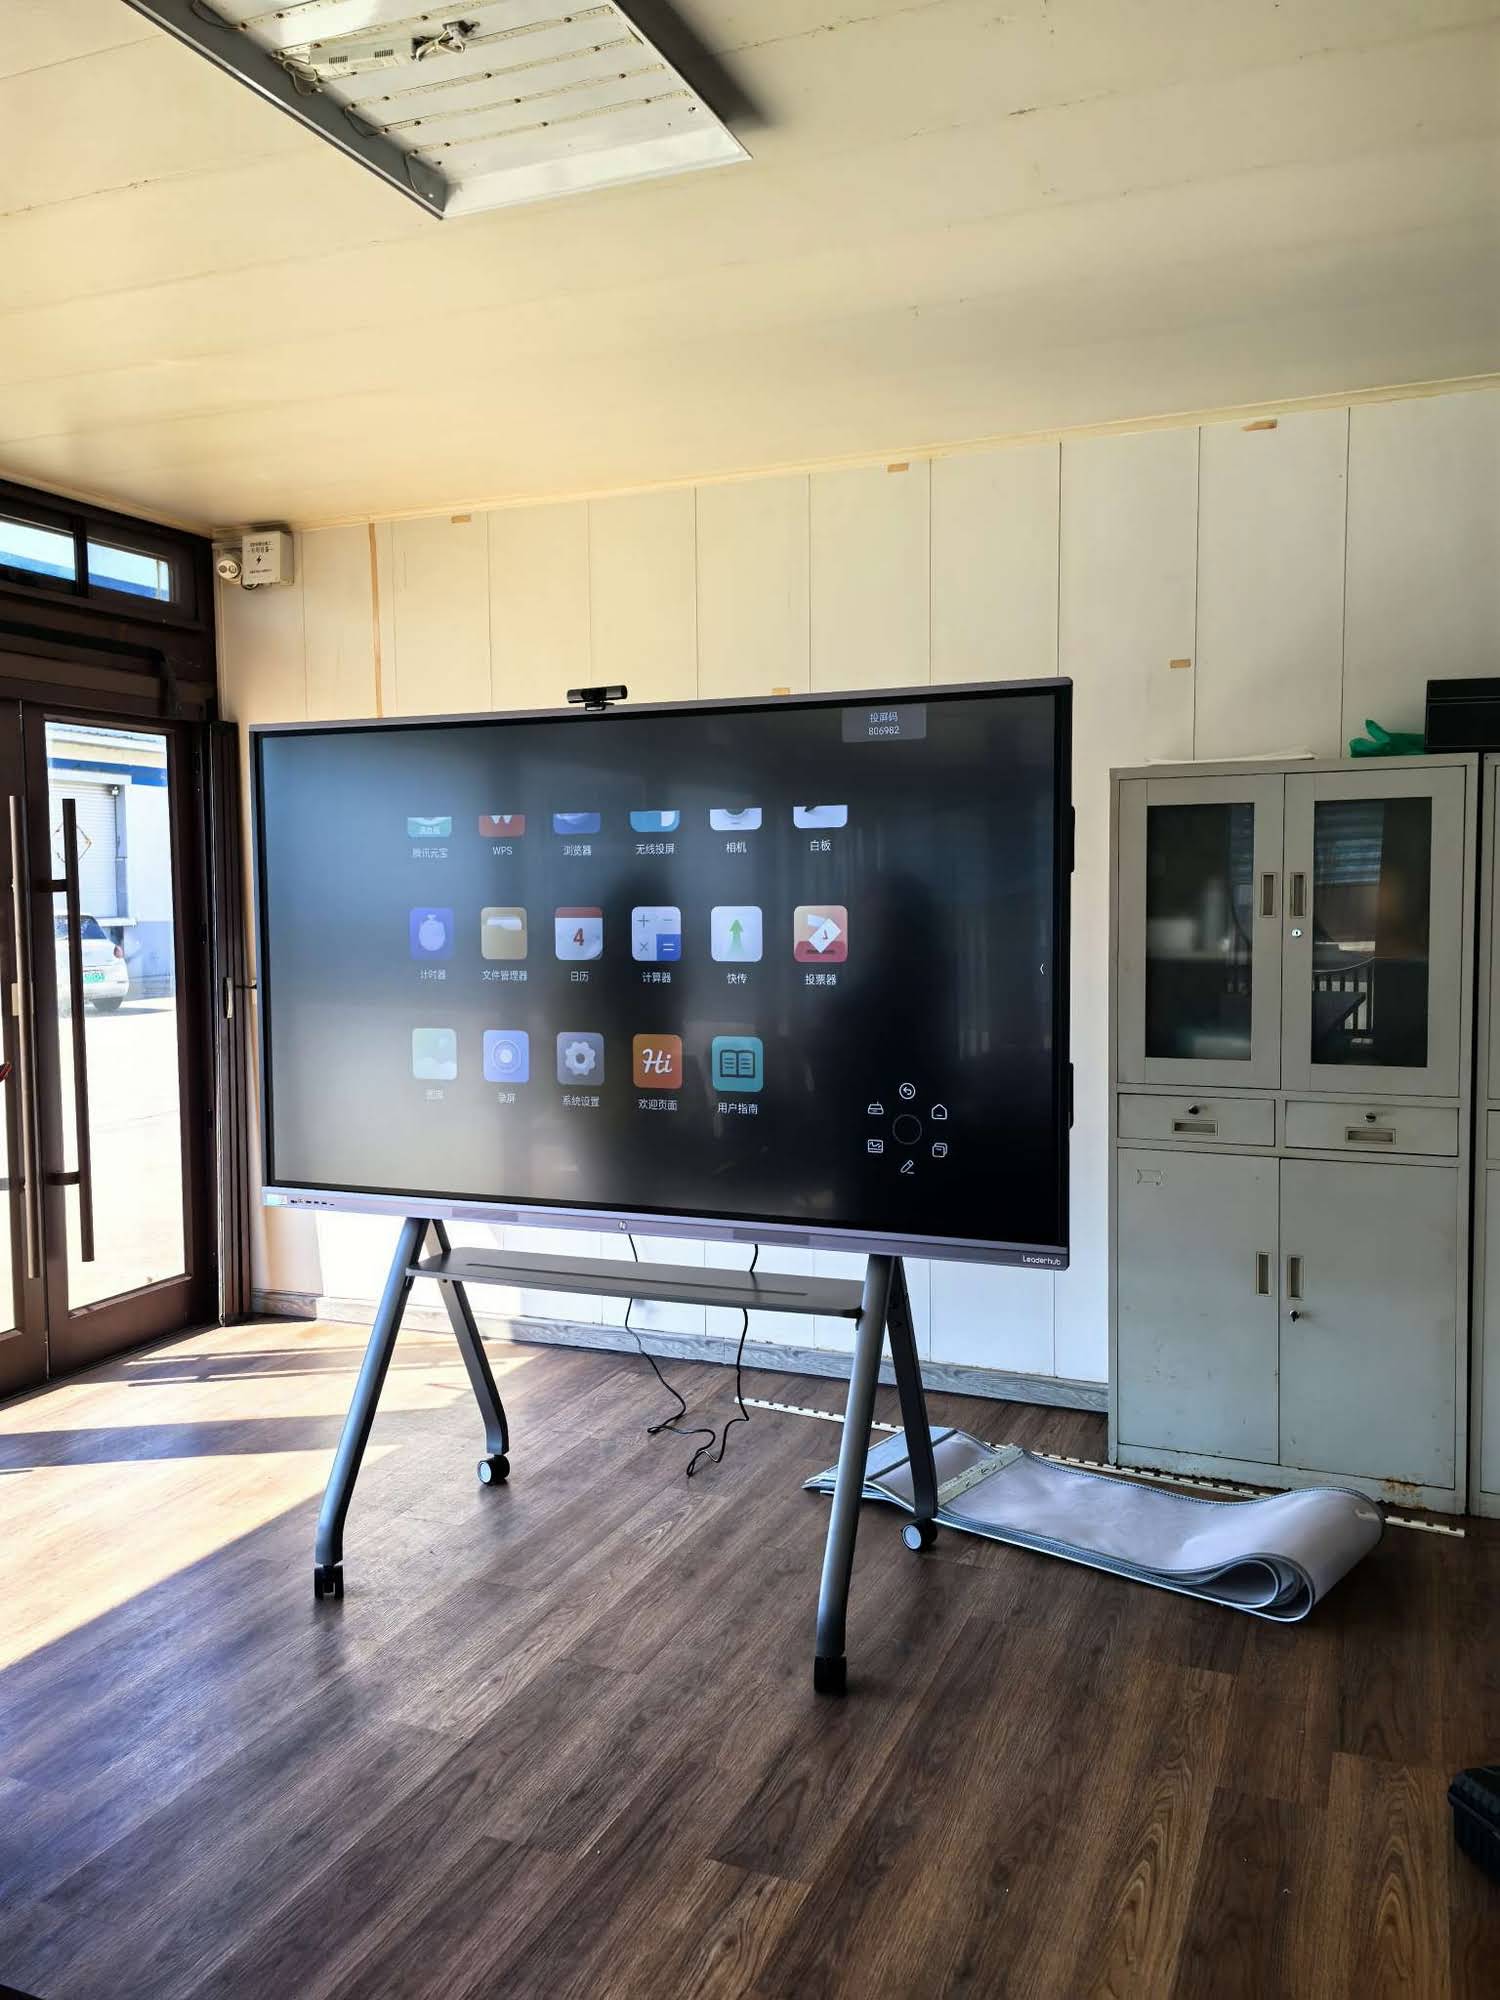
Essential Features to Look For in a Performance Analysis Smart Board
| Feature | Why It Matters for KPI Analysis |
|---|---|
| 4K UHD resolution | Dense dashboards with small text and multiple charts remain sharp and legible. |
| 20-point+ multi-touch | Several people can filter, zoom, and annotate simultaneously during group reviews. |
| Dual OS (Android + Windows OPS) | Run lightweight apps on Android and full BI desktop clients on Windows. |
| Wireless casting & split-screen | Compare two departments’ dashboards side by side from two different laptops. |
| Cloud whiteboard with save/export | Annotations and action items are stored and emailed to attendees automatically. |
| Built-in camera & mic array | Remote regional managers join the review and see the same live dashboard. |
| Anti-glare glass & 24/7 rating | Suitable for always-on performance walls in bright open offices. |
| Rotatable / mobile stand | Portrait mode suits tall ranking lists; mobility lets one board serve several teams. |
Practical Use Cases Across Departments
Sales Floor Leaderboard
A portrait-oriented 75″ board shows the live rep ranking, team quota progress, and deals closed today. Sales managers tap a rep’s name to open their pipeline and coach on the spot. Public visibility of progress typically lifts activity levels without adding meetings.
Operations Control Wall
An 86″ or 110″ panel in the production office displays OEE, line status, and defect trends per shift. When a line turns red, the supervisor annotates the cause directly on the chart, and the saved image becomes part of the shift handover record.
Customer Support Command Center
Ticket volume, SLA breaches, and CSAT scores update in real time. During peak hours the team lead reassigns queues by dragging tickets on the touchscreen through the helpdesk web app.
Executive Monthly Business Review
Leadership walks through each department’s dashboard in turn, drilling into variances. Instead of 60 slides, the meeting runs on three live dashboard pages — and every decision is written on the board and exported as a PDF action list.
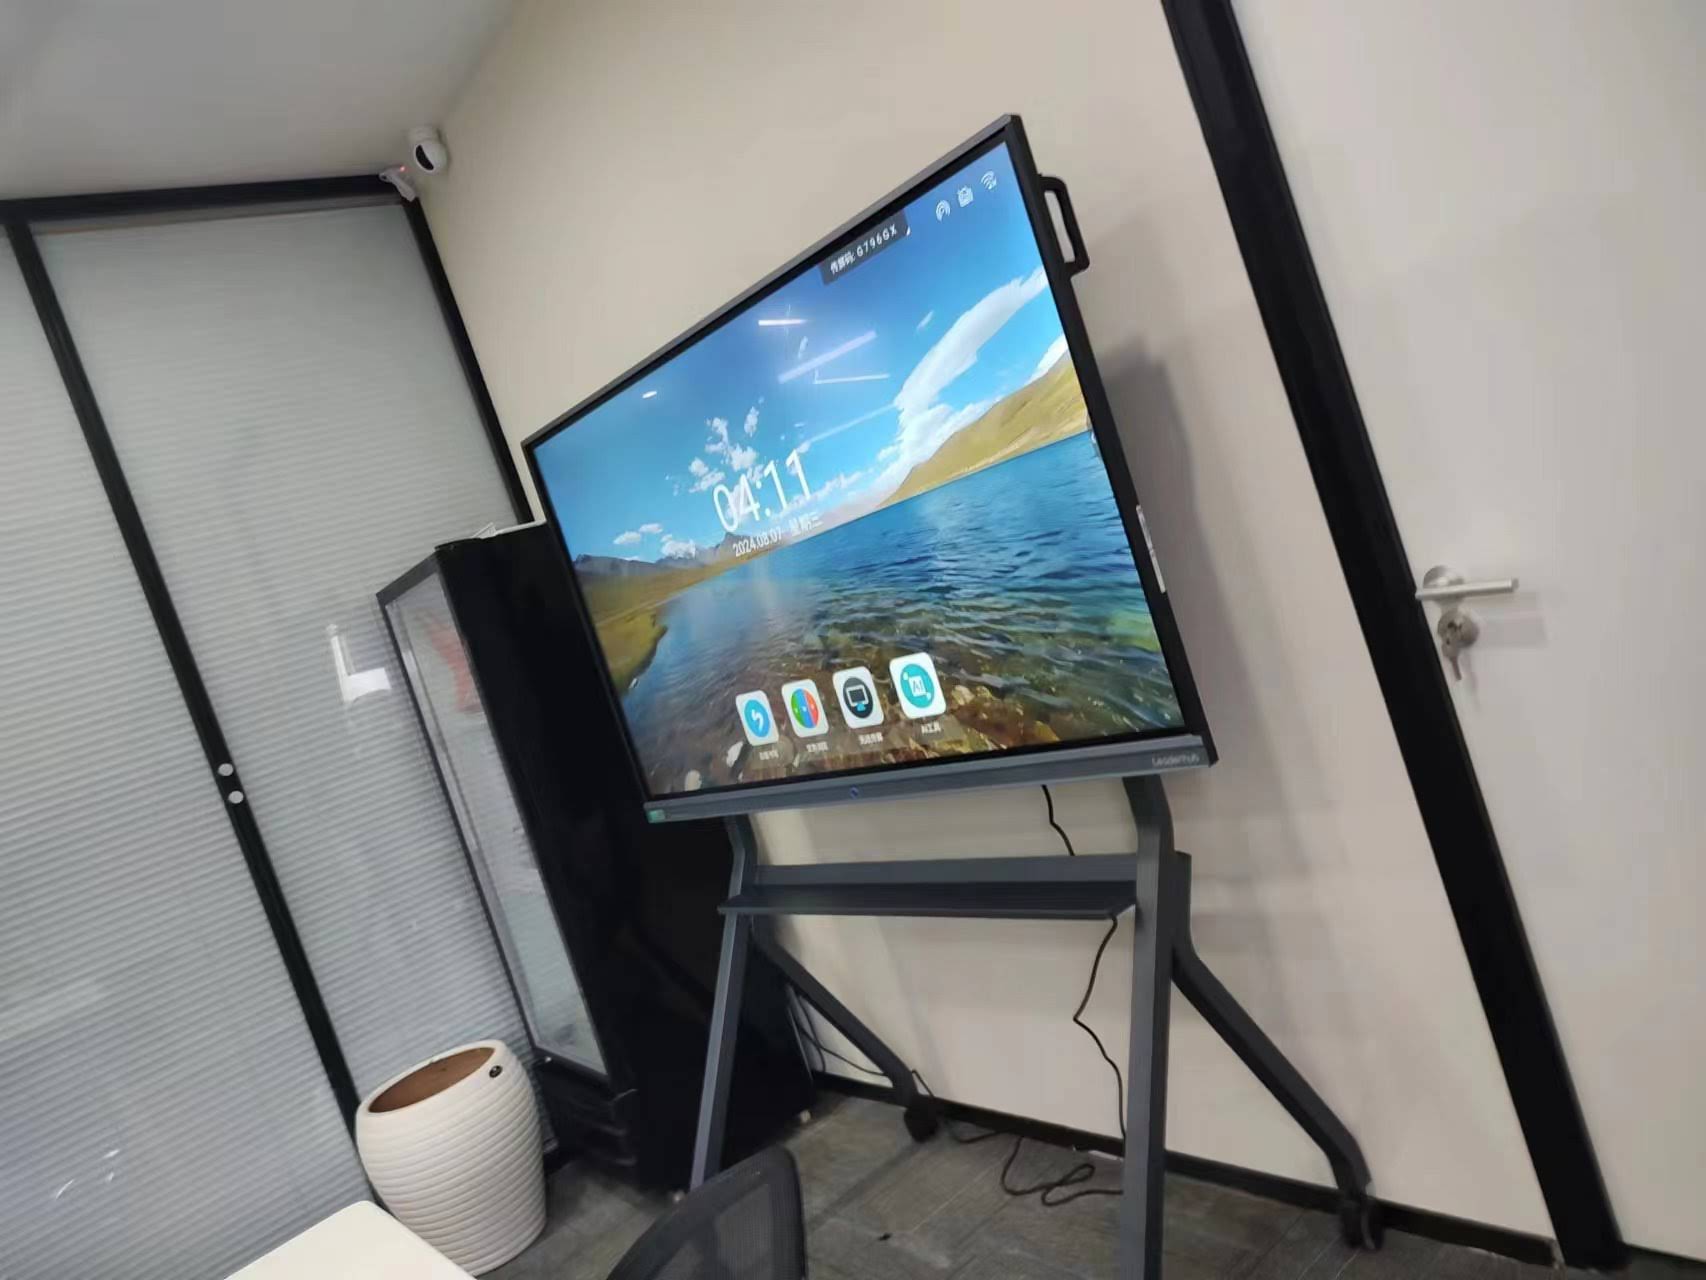
Boosting Efficiency: Measurable Gains From a Smart Dashboard Board
Organizations that move from static reporting to interactive dashboard reviews commonly report improvements in the following areas:
- Shorter meetings — no setup time, no cable hunting, no slide decks to rebuild; teams typically cut review meetings by 20–30%.
- Faster decision cycles — questions are answered with a drill-down on the spot rather than “I’ll check and get back to you.”
- Higher accountability — when the whole team sees the same number every morning, ownership becomes visible.
- Better cross-functional alignment — marketing sees how its leads convert in sales; operations sees how delays affect support tickets.
- Reduced reporting workload — analysts spend less time producing decks and more time analyzing causes.
Making Data-Driven Decisions: A Simple Framework for the Board
To turn dashboard viewing into decision making, run every KPI review through a four-step loop that fits naturally on a touchscreen:
- See — display the KPI against target and trend.
- Ask — drill down to find where and why the variance occurs; annotate the finding.
- Decide — write the action, owner, and deadline directly on the board next to the chart.
- Follow up — reopen the saved annotated page at the next review and check whether the number moved.
This closed loop is what differentiates a true performance analysis tool from an expensive television.
Choosing the Right Hardware: Size and Budget Guide
The table below maps common departmental scenarios to suitable interactive display configurations.
| Scenario | Suggested Size | Example Model | Typical Price |
|---|---|---|---|
| Small team huddle / mobile dashboard | 65″ | L65ZM 65″ 4K Smart Panel | from $1,099 |
| Standard conference room KPI review | 75″ | L75HM 75″ 4K Touchscreen | from $1,599 |
| Department performance wall | 86″ | L86ZM 86″ 4K Smart Panel | from $1,699 |
| Boardroom / command center | 110″ | L110H 110″ Interactive Flat Panel | from $7,999 |
| Always-on dashboard engine | Add-on | LP5C Mini PC (i5, 16GB) | from $799 |
Mid-sized companies often find the 75″–86″ range the sweet spot: large enough for a shared wall, affordable enough to deploy one per department. For a wider overview of value-oriented options, this China smart board selection guide compares specifications across global enterprise markets.
Common Mistakes to Avoid
- Dashboard overload — cramming 20 charts onto one screen makes everything unreadable from a distance.
- Vanity metrics — showing page views or follower counts that nobody acts on. Every KPI should link to a decision.
- No data owner — if nobody is responsible for data accuracy, the board loses credibility within weeks.
- Treating it as a projector — if the board only mirrors a laptop, you miss the touch, annotation, and multi-user value.
- Skipping the routine — a board without a scheduled review cadence quickly becomes wallpaper.
About the Hardware Behind This Guide
Leaderhub is a Shenzhen-based interactive display manufacturer with 16 years of experience and products delivered to more than 82 countries. Its range of 4K smart whiteboards, interactive flat panels, mini PCs, and portable smart screens is designed to help small and medium-sized enterprises run more effective, data-centered meetings — combining hardware innovation with AI to improve business-interaction efficiency. You can browse the full smartboard lineup or contact the team for departmental deployment advice.
Frequently Asked Questions
Can a smart board connect directly to Power BI or Tableau?
Yes. Most interactive flat panels include a full web browser and support Windows via an OPS module or external mini PC, so cloud BI dashboards open natively and remain fully interactive on the touchscreen.
Is a smart dashboard board suitable for 24/7 display?
Commercial-grade panels are rated for extended daily operation. For a true always-on performance wall, pair the display with a dedicated mini PC and enable screen-saver or dimming schedules to extend panel life.
How many people can interact with the dashboard at once?
Boards with 20-point or 40-point touch allow several participants to filter, draw, and zoom simultaneously, which is ideal for collaborative KPI reviews.
What is the difference between a smart board and a digital signage screen?
Digital signage is output-only; a smart board is bidirectional. You can touch, drill down, annotate, save, and video-conference — turning passive viewing into active analysis.
How long does setup take?
Wall mounting and network connection typically take under two hours. Configuring dashboards depends on your data sources, but most departments can have a first working view live within a day.
A smart board for departmental performance analysis is ultimately less about the screen and more about the habit it creates: a team that gathers around shared, live data and leaves every review with clear, owned actions. Choose the right size, connect the metrics that matter, build a review rhythm, and the board becomes the operational heartbeat of your department.